Big Faceless Graph Library 2.4 Documentation
Contents
- Introduction
- Installing - How to install the library
- Getting Started - How to create your first graph using the API, XML or JSP interface
- JSP Usage - combining with JSTL and other tricks
- Formats, Sizes and Colors - Creating graphs in different formats and defining their colors and sizes
- Interactive Graphs - Using JavaScript to create interactive graphs
- Web Services - creating graphs from a plain XML or SOAP Web Service
- Extending - creating custom Axes to format the data
- Examples
- A Bar Graph with more than one series, demonistrating the Z axis
- A "multi" bar graph, displaying the same data as above but in 2D
- A "stacked" bar graph, demonstrating round bars
- Rotating a Bar graph 90° and floating the bars
- TV Ratings - a Line Graph demonstrating Titles, Keys and a Gap Axis
- A Simple Area Graph
- European Population - a Bar Graph demonstrating labels and HTML titles
- NASDAQ Composite - a Candle Graph demonstrating lines and rotated text on an axes
- NASDAQ Composite again - combining bars and lines with two Y axes
- Painting with textures
- Bubbles
- JavaScript Rollovers
- Mathematical Curves - plotting functions and rollovers on lines
- Pie Graphs
- More Pie Graphs
- A scatter graph
- Logarithmic Axes
- A Dial Graph
1. Introduction
This document describes the Big Faceless Graph Library v2.0, which
is available for download at
http://bfo.com/products/graph.
It's intended to be a general high-level guide to the libraries features - for
full reference material the API and XML documentation should be consulted
Version 2 of the Graph Library builds upon version 1, but adds support for pretty much every
request we've received over the last 5 years. Some of the main features include:
- Full 3D engine - all graphs are rendered in shaded 3D and may be rotated to
any angle
- Plot to PNG, PDF, Flash, SVG or
java.awt.Image
- Graph Dates, Currencies, Percentages, Numbers and Discrete data out of the
box, easily extended for total control over the axes.
- XML interface - graphs may be defined in XML as well as by calling the
API
- JSP/Tag Library interface - graphs may be drawn directly into a page using
JSP tags, including embedded JavaScript for rollovers etc.
- Plot any number and type of series against the same Axes
Version 2 of the library uses a very different API to version 1, although some of the
concepts are the same. At this stage we are not planning to release a compatibility layer,
as the only point in upgrading would be to access new features (which would not be available
through the version 1 API).
2. Installing
Installing the library for most uses is as simple as adding the
bfograph.jar file to your CLASSPATH - the library does
not require any additional JARs, although they may be needed for some features
to work. Specifically, creating graphs from XML will require a SAX parser, and creating
graphs to PDF will require our PDF
library.
If you're planning on creating graphs from a JSP page or Web Service, these are the steps you
need to follow to install the Tag library.
- Copy the
bfograph.jar file to the WEB-INF/lib
directory of your web application (if this directory doesn't exist, create
it).
- The following blocks must be added to your
WEB-INF/web.xml file:
<servlet>
<servlet-name>GraphServlet</servlet-name>
<servlet-class>org.faceless.graph2.tag.GraphServlet</servlet-class>
</servlet>
<servlet-mapping>
<servlet-name>GraphServlet</servlet-name>
<url-pattern>/servlet/GraphServlet/*</url-pattern>
</servlet-mapping>
<taglib>
<taglib-uri>http://big.faceless.org/products/graph</taglib-uri>
<taglib-location>/WEB-INF/lib/bfograph.jar</taglib-location>
</taglib>
The tag library works by storing the graph in the Servlet Context, then
adding an img tag to the HTML which loads the image from a servlet - the
GraphServlet. The path to that servlet is specified in the
url-pattern above, and should be set to /servlet/GraphServlet/* (note
the trailing asterisk - this is very important).
This path may be changed, if necessary, by setting a context-param called
org.faceless.graph2.tag.ServletPath to the required URL (not including the
asterisk). If your Servlet Engine is beyond a proxy you can specify the full path through
that proxy by including a host (eg //myhost.com/context/servlet/GraphServlet)
or a host and a protocol (eg http://myhost.com/context/servlet/GraphServlet).
The only other setting you might need to change is the number of graphs stored by the
GraphServlet. This defaults to 50, but if you're receiving 404 errors
stating the Graph has expired you can increase this number by setting an
init-param on the GraphServlet named storesize to a higher number.
The second block loads the tag library itself. This block should be defined after all your
servlets, so generally you would put this last, just before the closing
</web-app>.
If you're using the Tag Library to create Interactive graphs (with rollovers etc.), then
you will also need to put the bfograph.js file in your web application somewhere and
include it in any webpages you create with interactive graphs.
3. Getting Started
Now the library is installed, it's time to run a couple of tests. If you're calling the API
directly, try the following code:
AxesGraph graph = new AxesGraph();                             // 1. Create Graph
BarSeries series = new BarSeries("Fruit");                     // 2. Create Series
series.set("Apples",10);
series.set("Oranges",20);
series.set("Bananas",13);
series.set("Cherries",12);
series.setBarWidth(0.8);                                       // 3. Set the BarWidth to 80%
graph.addSeries(series);                                       // 4. Add Series to Graph
ImageOutput out = new ImageOutput(300, 200);
graph.draw(out);                                               // 5. Draw Graph to Output
out.writePNG(new FileOutputStream("BarGraphExample.png"), 0);  // 6. Save as PNG to file
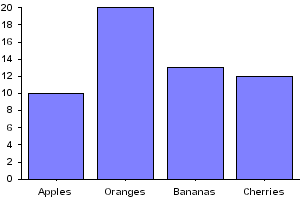
This is hopefully fairly self-explanatory - a graph is created, a series is created and
added to that graph, then the graph is drawn to an Output object, which in
this case is an ImageOutput. This can then be rendered to a PNG by calling the
writePNG method.
If you'd rather define your graphs in XML, you can use the XMLGraph class to
parse the XML and create a graph. The XMLToGraph.java example supplied with
the library can be used to parse XML from a file or URL and write the graph to a file. Here
is some XML which gives identical results to the example above:
<?xml version="1.0"?>
<axesgraph width="300" height="200">
<barseries name="Fruit" barwidth="80%">
<data x="Apples" y="10"/>
<data x="Oranges" y="20"/>
<data x="Bananas" y="13"/>
<data x="Cherries" y="12"/>
</barseries>
</axesgraph>
Save this XML to a file, change into the examples directory and run
java XMLToGraph yourfile.xml - you will get a file called
yourfile.png containing your graph.
The JSP interface is almost identical to the XML above. The main differences are that you
must include the tag library in your JSP, and you must prefix all the tags with an
appropriate prefix (we recommend bfg) to invoke the tag library. Here's the
same graph again, embedded in a JSP - the results are displayed alongside.
<%@ taglib uri="http://big.faceless.org/products/graph" prefix="bfg" %>
<bfg:axesgraph width="300" height="200">
<bfg:barseries name="Fruit" barwidth="80%">
<bfg:data x="Apples" y="10"/>
<bfg:data x="Oranges" y="20"/>
<bfg:data x="Bananas" y="13"/>
<bfg:data x="Cherries" y="12"/>
</bfg:barseries>
</bfg:axesgraph>
As you can see, using this method it is very simple to embed a graph into a web-page.
The tag-library method has other benefits beyond simplicity - you can use roll-overs on
the graph to assign JavaScript actions to various points on the graph. Throughout this
documentation we'll be demonstrating various graphs, all of which are created using this
method. The attribute names for JSP and XML generally map very closely to the method names
in the API, so although we'll be chiefly demonstrating graphs using the JSP interface it
shouldn't be too hard to convert these to the API.
4. JSP Usage
The Graph Library tag library can be combined with other tag libraries, like JSTL. Here's a quick
example showing how this is done (JSTL markup is highlighted):
<%@ taglib uri="http://big.faceless.org/products/graph" prefix="bfg" %>
<%@ taglib uri="http://java.sun.com/jsp/jstl/core" prefix="c" %>
<html xmlns="http://www.w3.org/1999/xhtml">
<body>
<%
session.setAttribute("items", new String[] { "A", "B", "C", "D" });
%>
<bfg:axesgraph width="300" height="200" id="mygraph">
  <bfg:barseries name="Test" barwidth="0.8">
    <c:forEach items="${items}" var="i">
      <bfg:data x="${i}" y="<%=Double.toString(Math.random()*10)%>" />
    </c:forEach>
  </bfg:barseries>
</bfg:axesgraph>
</body>
</html>
This example makes use of the Expression Language added in the Servlet 2.4 Specification; it's a good
fit with JSTL and worth using
(here's a primer
to get you started). This isn't required however - tags from the graph library can be interleaved
with tags from other tag libraries without any special syntax.
Notice also the value of the y attribute in the examples above must be passed as a String,
not a number. This isn't always the case, but for some attributes that can take multiple types
of data (y can accept numbers or dates), limitations in some JSP implementations require that
the parameter is specified as a String.
Generally speaking the URL of the image created by the tag library is of no interest to the page
author, but if necessary it can be derived - appending
<p>The URL of the generated image is ${bfgimagepath}/mygraph"</p>
to the JSP page would display the URL of the image (note mygraph is the ID attribute of the image - this must be specified if you need to retrieve the URL of the image).
5. Graph formats, sizes, colors
When using the API and XML interfaces, the file format of the rendered graph is down to the
programmer - they can write to PNG, SVG or any of the other supplied Output
classes. When using a Tag Library, this is controlled by the format attribute
on the graph tag. The default value, png, causes the graphs to be saved as
PNG images, but this can be set to svg to embed the graphs as SVG, or flash to embed them as Macromedia Flash images instead.
(Note currently Flash and SVGs do not work with JavaScript, so the notes section on interactivity would not apply).
Graph size can be controlled by the width and height attributes,
which are mandatory, and other tags appropriate to an image can be added - for example, to
put a border around the graph, adding border="1" would result in the image
being embedded in the page with border="1". Any other HTML4.0 tags that can be
applied to an img or object can be used.
Colors in the graph may be one of the following options:
- One of the fixed values
none, black, red, blue, yellow, orange, gray, white, transparent
- Specified as #RRGGBB (e.g.
#F0FFFF) or rgb() (eg rgb(240,255,100%) - the same color).
- Specified as
transparent(c, n), where c is a color and n is a percentage specifiying the opacity of the color - 100% is opaque, 0% is transparent.
- A pattern, specified as
pattern(n, [fg, bg]), where n is the name or URL of a bitmap pattern and the optional fg and bg parameters are the foreground and background colors to use (specified as a fixed color or as #RRGGBB). The pattern may be specified as a URL to a PBM format image, or one of the predefined values bricks, circles, crosshatch, crosshatch30, crosshatch45, fishscales, gray0, gray10, gray15, gray20, gray25, gray30, gray35, gray40, gray45, gray5, gray50, gray55, gray60, gray65, gray70, gray75, gray80, gray85, gray90, gray95, hexagons, horizontal, horizontalsaw, hs_bdiagonal, hs_cross, hs_diagcross, hs_fdiagonal, hs_horizontal, hs_vertical, left30, left45, leftshingle, octagons, right30, right45, rightshingle, scatter1, scatter2, smallfishscales, vertical, verticalbricks, verticalleftshingle, verticalrightshingle, verticalsaw or weave. Bitmap patterns were added in release 2.1.1
- A URL may be specified for a color, in which case the library will attempt to load a bitmap (GIF, JPEG or PNG) from the URL and convert it to a
java.awt.TexturePaint.
hsl(h, s, l) or hsv(h, s, v) can be used to specify RGB colors using Hue/Saturation/Lightness or Hugh/Saturation/Value. You can also use hsla and hsva if you want to include an alpha value.cmyk(c, m, y, k) can be used to specify CMYK colors, where c, m, y and k are percentages between 0 and 100% (or values between 0 and 255). For instance, cmyk(255, 0, 0, 100%) is a CMYK color with 100% cyan and black. Note CMYK color requires our PDF Library to be in the classpath. Use of CMYK colors in a format that doesn't support CMYK (e.g. PNG, SVG) is allowed, and they will be converted to the nearest RGB equivalent.spot(ink, color) can be used to specify a spot or separation color: ink is the name of the ink (quoted, if it contains spaces) and color is the equivalent color in a process colorspace, eg RGB, CMYK or HSL. For example, spot("Pantone Reflex Blue CVC", cmyk(100%, 73%, 0, 2%)) Note spot color requires our PDF Library to be in the classpath. Use of Spot colors in a format that doesn't support them (and only PDF supports them) is allowed, and the process color equivalent will be used: this will probably involve conversion to RGB as described above.lab(L, a, b) can be used to specify a color in the CIELab colorspace. This is primarily useful when defining spot colors, as many color swatches (e.g. recent Pantone) define their colors in this space. L, a and b are the individual components, with values ranging from 0..255, -128..127 and -128..127. For example, the same 'Pantone Reflex Blue' referenced in the previous example could also be defined as follows: spot("Pantone Reflex Blue CVC", lab(26.18, 18.64, -59.93)) Note CIELab color requires our PDF Library to be in the classpath. Use of Lab colors in a format that doesn't support them (and only PDF supports them) is allowed, and the process color equivalent will be used: this will probably involve conversion to RGB as described above.- For BarSeries only
gradient(c1, c2) may be used to draw a gradient from the colors c1 to c2. If you're running Java 1.6 you can specify more than two colors as well as the points where the colors transition: for instance, gradient(red, 5, green, 10, blue, 15) would smoothly transition from the minimum value to red when the value is 5, then to green at 10 and blue at 15. For hard transitions you can specify two close together numbers, eg gradient(green, 5, yellow, 5.001, yellow, 8, red, 8.001) will be green below 5, yellow between 5 and 8 and red above 8. The colors can be specified in RGB or CMYK. Note that gradients with more than 2 colors cannot be used when rendering to PDF.
6. Creating Interactive Graphs
It is possible to create interactive graphs using the Tag Library - by interactive we
mean using JavaScript to do rollovers, clicks and so on. These features are not directly
available with the XML and API interfaces, because those approaches don't create web pages
directly - although the hooks are there.
In order to understand this aspect of the library, you need some background on how the
graphs are created. As explained above, the tag library works by parsing the tags, creating
the graph and storing it in the Servlet Context, then writing some HTML to the page being
creating which loads that image from the GraphServlet. Adding interactive features to a
graph causes an ImageMap to be created as well, using the HTML4.0
area tag. This area is associated with the image, and the various polygons in
the imagemap have the appropriate JavaScript added to them.
For interactive SVG graphs (added in 2.1), the process is similar but simpler, as the
JavaScript/ECMAScript required for interaction is actually embedded in the SVG itself.
The XML is almost identical to that used by the bitmap-based interactive graphs - the
only difference is the <script> tag must be embedded directly into the
graph XML, rather than in the PDF page. An example of this can be seen here.
The following HTML4.0 attributes can be used on marker, data and
lineseries tags:
- href
- target
- title
- onmouseover
- onmouseout
- onclick
- ondblclick
- onmousedown
- onmouseup
- onmousemove
- onkeypress
- onkeydown
- onkeyup
So, for instance, a bar in a bargraph can be turned into a hyperlink simply by adding an
href to the bfg:data tag.
Linegraphs are a little different, because they represent a continuous curve of values.
Consequently any HTML4.0 tags in a Line series are applied to the lineseries, rather
than the data. The Sine curve example shows how this
is done. Two special variables which are defined which allow you to display the value of the
line under the mouse pointer - roll the mouse over the approximate line in the example above
and you will see the values of the curve displayed in a popup. This is done by using the
special variables seriesx and seriesy. When the Tag Library sees these variables, it
replaces them with a call to a function which will return the values you'd expect.
7. Graphs as a Web Service - SOAP and XML
Although typically the JSP tags are the best way to add dynamic interactive graphs to your application,
this approach will not work for everyone. Those trying to integrate the graphs into a .NET application
for instance won't be able to use this approach, and there are many other non-web applications which
would still like to be able to create graphs on a remote server.
In 2.0.3 the ability to create graphs as a web service was added. This is done with a SOAP
request, and raw XML may also be parsed. The server-side setup is exactly the same as for the tag library
- the web.xml file should be exactly the same. No additional JARs are required as we do all
the SOAP parsing internally. The requests are made to the GraphServlet, which
generates the graph and returns it in one of several ways. The XML that describes the graph is exactly
the same as used for the tag library - optionally including the interactive attributes listed above.
Those using the SOAP interface will find the bfograph-2.0.wsdl in the docs directory
useful, as it defines the available web-services. Note that as supplied this WSDL points to our own demo
server. This is almost certainly not what you want to do - for a start, all the graphs will be DEMO
stamped. Be sure to modify the WSDL to point to the URL of your local installation.
Now a few examples. The first and simplest approach is simply to convert raw XML into a graph. To do this
you simply POST the XML defining the graph to the url /servlet/GraphServlet/xml-raw, and the
graph will be returned directly. An example HTTP session might look like this (request and response are
separated by a dotted line):
POST /yourwebapplication/servlet/GraphServlet/xml-raw HTTP/1.1
Host: www.yourserver.com
Content-Type: text/xml; charset=UTF-8
Content-Length: 228
<?xml version="1.0"?>
<piegraph height="400" width="400" yrotation="-40">
<label font="18pt bold Arial">My First Pie Graph</label>
<data key="apples" value="18" />
<data key="oranges" value="22" />
</piegraph>
HTTP/1.1 200 OK
Content-Type: image/png
Content-Length: 9580
Connection: close
Date: Mon, 10 Oct 2005 14:15:49 GMT
... PNG formatted image follows...
/xml-raw), and the Content-Length header, which must be the size of your
XML in bytes. The encoding is also crucial, as the default encoding for XML is UTF-8, while the default
encoding for HTTP is ISO-8859-1. We recommend always encoding your XML requests as UTF-8, and setting
the encoding of the request explicitly as we've done above.
The xml-raw signifies to the GraphServlet that XML is coming in and a raw image is
expected as output. Other possibilities include xml-html, which parses the same raw XML but returns
a snippet of HTML which could be included into a page to load the image. Here's an example:
POST /yourwebapplication/servlet/GraphServlet/xml-html HTTP/1.1
Host: www.yourserver.com
Content-Type: text/xml; charset=UTF-8
Content-Length: 228
<?xml version="1.0"?>
<piegraph height="400" width="400" yrotation="-40">
<label font="18pt bold Arial">My First Pie Graph</label>
<data key="apples" value="18" />
<data key="oranges" value="22" />
</piegraph>
HTTP/1.1 200 OK
Content-Type: text/html; charset=UTF-8
Connection: close
Date: Mon, 10 Oct 2005 14:15:49 GMT
<img src="http://www.yourserver.com/yourwebapplication/servlet/GraphServlet/image/1" width="400" height="400" />
So instead of returning the image directly, it stores it and passes back a URL to request it. This route
also means more than just the image can be returned - if actions are defined in the XML then the returned
HTML would include an image map and javascript to call those actions. In fact this applies to any request type
other than xml-raw, not just xml-html.
Two variations on xml-raw and xml-html were added in 2.3.1.
xml-raw-form and xml-html-form work in an identical way, but instead of reading the
XML directly from the HTTP request content, the XML is read from a parameter called xml. This is a much
simpler way of getting up and running with web services, as it means you can create a form field called xml,
populate it with the XML you want to convert and then submit the form to
servlet/GraphServlet/xml-raw-form to get the image back. The form can be submitted as a POST or a
GET, although be aware some older browsers have a limit on the size of the URL in a GET request.
For a slightly more structured approach, you can format the request as a SOAP (Simple Object Access Protocol)
request. The library understands both SOAP 1.1 and
SOAP 1.2 requests, and will format the
response as a SOAP response of the same version as the request.
For SOAP requests, the XML defining the graph is wrapped inside a request object which determines the
type of SOAP request being made. SOAP doesn't handle raw binary data well, so there are two methods for
returning the image. The first is GetHTML, which is similar to xml-html -
some HTML is returned as the body of the SOAP response, and the image is stored on the server:
POST /servlet/GraphServlet/soap HTTP/1.0
Host: yourserver.com
Content-Type: application/soap+xml; charset="utf-8"
Content-Length: 611
<soap:Envelope
xmlns:bfg="http://bfo.co.uk/ns/graph?version=2"
xmlns:bfgsoap="http://bfo.co.uk/ns/graph/soap?version=2"
xmlns:soap="http://schemas.xmlsoap.org/soap/envelope/">
<soap:Body>
<bfgsoap:GetHTML>
<bfg:axesgraph width="600" height="600">
<bfg:barseries name="January">
<data x="Frank" y="50"/>
<data x="Wendy" y="68"/>
<data x="Kate" y="103"/>
</bfg:barseries>
</bfg:axesgraph>
</bfgsoap:GetHTML>
</soap:Body>
</soap:Envelope>
HTTP/1.1 200 OK
Content-Type: text/xml; charset=UTF-8
Connection: close
Date: Sat, 10 Dec 2005 18:34:36 GMT
BFO-Graph-Version: 2.1
<?xml version="1.0"?>
<soap:Envelope xmlns:soap="http://schemas.xmlsoap.org/soap/envelope/"
soap:encodingStyle="http://schemas.xmlsoap.org/soap/encoding/">
<soap:Body>
<html xmlns="http://www.w3.org/TR/REC-html40">
<img width="600" height="600" id="bfggraph3"
src="http://yourserver.com/servlet/GraphServlet/image/3/bfggraph3" />
</html>
</soap:Body>
</soap:Envelope>
As you can see the Body of the SOAP response contains a block of XHTML containing the code to inject
into the webpage. Also note that the request, like all SOAP requests, requires the XML passed in to have
a namespace specified. The namespace for the Graph Library XML is shown above, and is defined in the
constant XMLGraph.NAMESPACE for convenience. The GetHTML element also requires a
namespace, which is the bfgsoap namespace you can see defined in the XML above.
If you're not interested in the HTML and just want the image back, the GetMultipart method
returns the SOAP response as a multipart response, including both the HTML and the image as an attachment:
POST /servlet/GraphServlet/soap HTTP/1.0
Host: yourserver.com
Content-Type: application/soap+xml; charset="utf-8"
Content-Length: 622
<soap:Envelope
xmlns:bfg="http://bfo.co.uk/ns/graph?version=2"
xmlns:bfgsoap="http://bfo.co.uk/ns/graph/soap?version=2"
xmlns:soap="http://schemas.xmlsoap.org/soap/envelope/">
<soap:Body>
<bfgsoap:GetMultipart>
<bfg:axesgraph width="600" height="600">
<bfg:barseries name="January">
<data x="Frank" y="50"/>
<data x="Wendy" y="68"/>
<data x="Kate" y="103"/>
</bfg:barseries>
</bfg:axesgraph>
</bfgsoap:GetMultipart>
</soap:Body>
</soap:Envelope>
HTTP/1.1 200 OK
Content-Type: Multipart/Related; boundary=MIME_boundary; type="text/xml";
start="<bfggraph2.xml@yourserver.com>"
Connection: close
Date: Sat, 10 Dec 2005 18:31:58 GMT
BFO-Graph-Version: 2.1
--MIME_boundary
Content-Type: text/xml; charset=UTF-8
Content-Transfer-Encoding: 8bit
Content-ID: <bfggraph2.xml@yourserver.com>
<soap:Envelope xmlns:soap="http://schemas.xmlsoap.org/soap/envelope/"
soap:encodingStyle="http://schemas.xmlsoap.org/soap/encoding/">
<soap:Body>
<html xmlns="http://www.w3.org/TR/REC-html40">
<img width="600" height="600" id="bfggraph2"
src="cid:bfggraph2.img@yourserver.com?bfggraph2" />
</html>
</soap:Body>
</soap:Envelope>
--MIME_boundary
Content-Type: image/png
Content-Transfer-Encoding: binary
Content-ID: <bfggraph2.img@yourserver.com?bfggraph2>
Content-Length: 8439
... 8439 bytes of PNG image ...
--MIME_boundary--
This technique can be used to return the HTML and the image in one request. The image can be
extracted directly from the response with a suitable API, such as
SAAJ from Sun.
8. Extending the Library
It's easy to extend the Axis class to plot custom values on an axis. The main
thing to remember is that inside the graph, everything is a number. Lets say for
example you want to plot a Line series against the days of the week. Your axis is going to
read Monday, Tuesday, Wednesday and so on, but internally the values stored in the
graph are going to be 0, 1 and 2. This is how dates are handled (they're converted to
doubles) and even bars - the first bar is treated as x=0, the second is x=1 and so on.
So here's our example:
package test;
import org.faceless.graph2.*;
public class MyAxis extends Axis {
private String[] days = { "Sun", "Mon", "Tue",
"Wed", "Thu", "Fri", "Sat" };
public MyAxis() {
super();
}
public String format(double x) {
return days[(int)x];
}
public double[] steps(double min, double max) {
return new double[] { 0, 1, 2, 3, 4, 5, 6 };
}
} | <axesgraph width="600" height="600">
<axis pos="bottom" type="test.MyAxis" />
<lineseries name="Values">
<data x="0" y="130" />
<data x="1" y="140" />
<data x="2" y="120" />
<data x="3" y="180" />
<data x="4" y="150" />
<data x="5" y="110" />
<data x="6" y="160" />
</lineseries>
</axesgraph> |
9. Some Examples
We suspect that the Graph Library is sufficiently simple to use that a few example, along
with the reference material, will be enough for most people to get started. With that in
mind we're going to demonstrate a few example graphs here for inspiration. Incidentally all
real-world data is believed to be correct in these graphs.
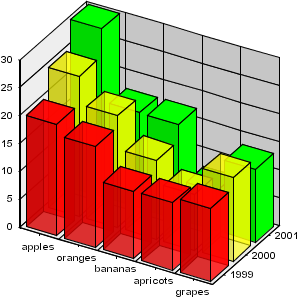
9.1 A Bar Graph with more than one series, demonstrating the Z axis
<%@ taglib uri="http://big.faceless.org/products/graph" prefix="bfg" %>
<bfg:axesgraph width="300" height="300" backwallpaint="stripe(#EEEEEE,line=black,axis=left,altaxis=bottom)" xrotation="30" yrotation="60" defaultcolors="transparent(red,0.8),transparent(yellow,0.6),green">
<bfg:axis pos="left" type="int" wallpaint="stripe(#EEEEEE,line=black)"/>
<bfg:axis pos="bottom" type="bar" wallpaint="stripe(#EEEEEE,line=black)"/>
<bfg:axis pos="z" type="zaxis"/>
<bfg:barseries name="1999" barwidth="0.8" bardepth="0.8">
<bfg:data x="apples" y="20"/>
<bfg:data x="oranges" y="18"/>
<bfg:data x="bananas" y="12"/>
<bfg:data x="apricots" y="12"/>
<bfg:data x="grapes" y="13"/>
</bfg:barseries>
<bfg:barseries name="2000" barwidth="0.8" bardepth="0.8">
<bfg:data x="apples" y="25"/>
<bfg:data x="oranges" y="20"/>
<bfg:data x="bananas" y="14"/>
<bfg:data x="apricots" y="10"/>
<bfg:data x="grapes" y="15"/>
</bfg:barseries>
<bfg:barseries name="2001" barwidth="0.8" bardepth="0.8">
<bfg:data x="apples" y="30"/>
<bfg:data x="oranges" y="17"/>
<bfg:data x="bananas" y="17"/>
<bfg:data x="apricots" y="7"/>
<bfg:data x="grapes" y="13"/>
</bfg:barseries>
</bfg:axesgraph>
This example shows how easy it is to create a bar graph with depth. Multiple series are
added and a Z-axis defined. Note here we've only used Bar series, but theoretically any
type of series can be used. For a bit of fun we've made the first two series translucent.
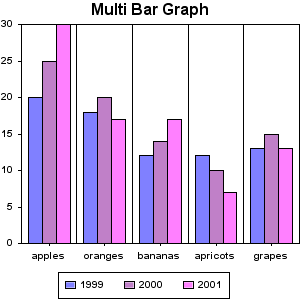
9.2 A "multi" bar graph, displaying the same data as above but in 2D
<%@ taglib uri="http://big.faceless.org/products/graph" prefix="bfg" %>
<bfg:axesgraph width="300" height="300" backwallpaint="stripe(line=black,axis=bottom)">
<bfg:label font="16pt bold Arial">Multi Bar Graph</bfg:label>
<bfg:axis type="int" pos="left" wallpaint="stripe(line=black)"/>
<bfg:axis type="bar" pos="bottom" wallpaint="stripe(line=black)"/>
<bfg:multibarseries name="Groups">
<bfg:barseries name="1999" barwidth="75%" bardepth="75%">
<bfg:data x="apples" y="20"/>
<bfg:data x="oranges" y="18"/>
<bfg:data x="bananas" y="12"/>
<bfg:data x="apricots" y="12"/>
<bfg:data x="grapes" y="13"/>
</bfg:barseries>
<bfg:barseries name="2000" barwidth="75%" bardepth="75%">
<bfg:data x="apples" y="25"/>
<bfg:data x="oranges" y="20"/>
<bfg:data x="bananas" y="14"/>
<bfg:data x="apricots" y="10"/>
<bfg:data x="grapes" y="15"/>
</bfg:barseries>
<bfg:barseries name="2001" barwidth="75%" bardepth="75%">
<bfg:data x="apples" y="30"/>
<bfg:data x="oranges" y="17"/>
<bfg:data x="bananas" y="17"/>
<bfg:data x="apricots" y="7"/>
<bfg:data x="grapes" y="13"/>
</bfg:barseries>
</bfg:multibarseries>
<bfg:key align="bottom" bordercolor="black"/>
</bfg:axesgraph>
If you prefer the look of 2D graphs but still need to display multiple series, the
multibarseries can help. As you can see it's very similar to the graph above.
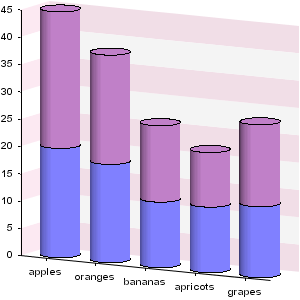
9.3 A stacked bar graph, demonstrating round bars
<%@ taglib uri="http://big.faceless.org/products/graph" prefix="bfg" %>
<bfg:axesgraph width="300" height="300" lightvector="3,0,-1" backwallpaint="stripe(#FCE9F2,white,axis=left)" xrotation="30" yrotation="20">
<bfg:axis type="int" pos="left" wallpaint="stripe(#FCE9F2,white)"/>
<bfg:stackedbarseries name="Groups">
<bfg:barseries name="1999" barwidth="70%" roundbars="true">
<bfg:data x="apples" y="20"/>
<bfg:data x="oranges" y="18"/>
<bfg:data x="bananas" y="12"/>
<bfg:data x="apricots" y="12"/>
<bfg:data x="grapes" y="13"/>
</bfg:barseries>
<bfg:barseries name="2000" barwidth="70%" roundbars="true">
<bfg:data x="apples" y="25"/>
<bfg:data x="oranges" y="20"/>
<bfg:data x="bananas" y="14"/>
<bfg:data x="apricots" y="10"/>
<bfg:data x="grapes" y="15"/>
</bfg:barseries>
</bfg:stackedbarseries>
</bfg:axesgraph>
Another way of combining multiple bar series is when the data is cumulative. A
stackedbarseries can be used to position bars on top of each other. Here we've
set the roundbars flag to true, and have played around with the light vector
slightly to reduce the shading on the back wall
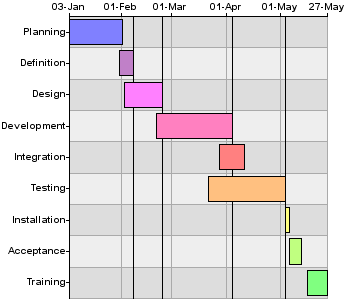
9.4 Rotating a Bar graph 90° and floating the bars
<%@ taglib uri="http://big.faceless.org/products/graph" prefix="bfg" %>.
<bfg:axesgraph width="350" height="300" zrotation="90">
<bfg:stripe line="#AAAAAA" axis="bottom" altaxis="left" fill="#DDDDDD, #EEEEEE"/>
<bfg:axis pos="bottom" type="bar" align="middle right"/>
<bfg:axis pos="left" type="date(dd-MMM)" align="bottom center" density="sparse"/>
<bfg:barseries name="timeline" barwidth="0.8">
<bfg:data x="Planning" min="03-JAN-2005" max="2-FEB-2005" color="#8080FF"/>
<bfg:data x="Definition" min="31-JAN-2005" max="8-FEB-2005" color="#C080C8"/>
<bfg:data x="Design" min="3-FEB-2005" max="24-FEB-2005" color="#FF80FF"/>
<bfg:data x="Development" min="21-FEB-2005" max="4-APR-2005" color="#FF80C0"/>
<bfg:data x="Integration" min="28-MAR-2005" max="11-APR-2005" color="#FF8080"/>
<bfg:data x="Testing" min="22-MAR-2005" max="4-MAY-2005" color="#FFC080"/>
<bfg:data x="Installation" min="4-MAY-2005" max="6-MAY-2005" color="#FFFF80"/>
<bfg:data x="Acceptance" min="6-MAY-2005" max="13-MAY-2005" color="#C0FF80"/>
<bfg:data x="Training" min="16-MAY-2005" max="27-MAY-2005" color="#80FF80"/>
<bfg:line y="8-FEB-2005" linethickness="1"/>
<bfg:line y="24-FEB-2005" linethickness="1"/>
<bfg:line y="4-APR-2005" linethickness="1"/>
<bfg:line y="4-MAY-2005" linethickness="1"/>
</bfg:barseries>
</bfg:axesgraph>
This example shows how to create a Gannt chart from a regular BarSeries. By putting dates
on the Y axis, using min and max on the bars and rotating the
whole thing by 90°, we've created a completely different type of graph with the same
components. It also uses the stripe element to specify the back wall paint:
this is an alternative to specifying the backwallpaint attribute, and they
both provide the same functionality.
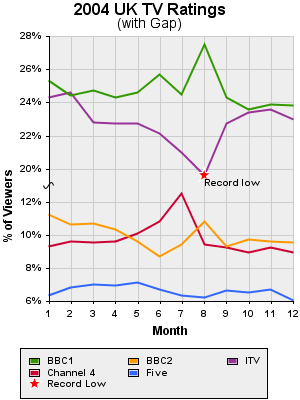
9.5 TV Ratings - a Line Graph demonstrating Titles, Keys and a Gap Axis
<%@ taglib uri="http://big.faceless.org/products/graph" prefix="bfg" %>
<bfg:axesgraph width="300" height="400" backwallpaint="stripe(#eeeeee,axis=bottom,line=#cccccc,altaxis=left)">
<bfg:label font="16pt bold Arial">2004 UK TV Ratings</bfg:label>
<bfg:label font="14pt Arial">(with Gap)</bfg:label>
<bfg:axis pos="left" type="gap(decimal(0%),0.13,0.19)">
<bfg:label font="12pt bold Arial">% of Viewers</bfg:label>
</bfg:axis>
<bfg:axis pos="bottom" type="int">
<bfg:label font="12pt bold Arial">Month</bfg:label>
</bfg:axis>
<bfg:lineseries name="BBC1" color="#339900" linethickness="2">
<bfg:data x="1" y="0.253"/>
<bfg:data x="2" y="0.244"/>
<bfg:data x="3" y="0.247"/>
<bfg:data x="4" y="0.243"/>
<bfg:data x="5" y="0.246"/>
<bfg:data x="6" y="0.257"/>
<bfg:data x="7" y="0.245"/>
<bfg:data x="8" y="0.275"/>
<bfg:data x="9" y="0.243"/>
<bfg:data x="10" y="0.236"/>
<bfg:data x="11" y="0.239"/>
<bfg:data x="12" y="0.238"/>
</bfg:lineseries>
<bfg:lineseries name="BBC2" color="#FF9900" linethickness="2">
<bfg:data x="1" y="0.112"/>
<bfg:data x="2" y="0.106"/>
<bfg:data x="3" y="0.107"/>
<bfg:data x="4" y="0.103"/>
<bfg:data x="5" y="0.096"/>
<bfg:data x="6" y="0.087"/>
<bfg:data x="7" y="0.094"/>
<bfg:data x="8" y="0.108"/>
<bfg:data x="9" y="0.093"/>
<bfg:data x="10" y="0.097"/>
<bfg:data x="11" y="0.096"/>
<bfg:data x="12" y="0.095"/>
</bfg:lineseries>
<bfg:lineseries name="ITV" color="#993399" linethickness="2">
<bfg:data x="1" y="0.243"/>
<bfg:data x="2" y="0.246"/>
<bfg:data x="3" y="0.228"/>
<bfg:data x="4" y="0.227"/>
<bfg:data x="5" y="0.227"/>
<bfg:data x="6" y="0.221"/>
<bfg:data x="7" y="0.210"/>
<bfg:data x="8" y="0.196"/>
<bfg:data x="9" y="0.227"/>
<bfg:data x="10" y="0.234"/>
<bfg:data x="11" y="0.236"/>
<bfg:data x="12" y="0.230"/>
<bfg:marker type="star" size="15" color="#FF0000" bordercolor="white" x="8" y="0.196"/>
<bfg:label x="8" y="0.196" align="top left" paddingtop="2">Record low</bfg:label>
</bfg:lineseries>
<bfg:lineseries name="Channel 4" color="#CC0033" linethickness="2">
<bfg:data x="1" y="0.093"/>
<bfg:data x="2" y="0.096"/>
<bfg:data x="3" y="0.095"/>
<bfg:data x="4" y="0.096"/>
<bfg:data x="5" y="0.101"/>
<bfg:data x="6" y="0.108"/>
<bfg:data x="7" y="0.125"/>
<bfg:data x="8" y="0.094"/>
<bfg:data x="9" y="0.092"/>
<bfg:data x="10" y="0.089"/>
<bfg:data x="11" y="0.092"/>
<bfg:data x="12" y="0.089"/>
</bfg:lineseries>
<bfg:lineseries name="Five" color="#3366FF" linethickness="2">
<bfg:data x="1" y="0.063"/>
<bfg:data x="2" y="0.068"/>
<bfg:data x="3" y="0.070"/>
<bfg:data x="4" y="0.069"/>
<bfg:data x="5" y="0.071"/>
<bfg:data x="6" y="0.067"/>
<bfg:data x="7" y="0.063"/>
<bfg:data x="8" y="0.062"/>
<bfg:data x="9" y="0.066"/>
<bfg:data x="10" y="0.065"/>
<bfg:data x="11" y="0.067"/>
<bfg:data x="12" y="0.060"/>
</bfg:lineseries>
<bfg:key align="bottom" color="#eeeeee">
<bfg:keyitem series="BBC1"/>
<bfg:keyitem series="BBC2"/>
<bfg:keyitem series="ITV"/>
<bfg:keyitem series="Channel 4"/>
<bfg:keyitem series="Five"/>
<bfg:keyitem marker="star" size="15" bordercolor="white" color="#FF0000">Record Low</bfg:keyitem>
</bfg:key>
</bfg:axesgraph>
Here's an interesting example. It demonstrates a few features we haven't covered yet. First, the axis on the left is a gap axis. BBC1 and ITV have considerably higher market share than the other channels, so to make them all fit in the one graph comfortably we've added a gap between 13% and 19% on the left axis. Second, we've added a marker to ITV to mark it's record setting low of 19.6% in August. Many graphs will look better with a marker on each point, but we've just used the one. We've also added some text to the graph in the same way. Third, we've chosen to override the default key so we can add the marker to it.
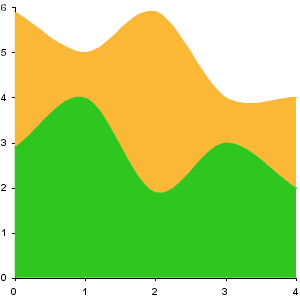
9.6 A Simple Area Graph
<%@ taglib uri="http://big.faceless.org/products/graph" prefix="bfg" %>
<bfg:axesgraph width="300" height="300" defaultcolors="#2FC71F,#FBB837">
<bfg:areaseries name="area">
<bfg:splineseries name="spline1" spline="catmullrom" bordercolor="transparent">
<bfg:data x="0" y="2.9"/>
<bfg:data x="1" y="4"/>
<bfg:data x="2" y="1.9"/>
<bfg:data x="3" y="3"/>
<bfg:data x="4" y="2"/>
</bfg:splineseries>
<bfg:splineseries name="spline2" spline="catmullrom" bordercolor="transparent">
<bfg:data x="0" y="3"/>
<bfg:data x="1" y="1"/>
<bfg:data x="2" y="4"/>
<bfg:data x="3" y="1"/>
<bfg:data x="4" y="2"/>
</bfg:splineseries>
</bfg:areaseries>
</bfg:axesgraph>
This is a very basic area graph that uses two spline series to plot points. It could use a lineseries,
functionseries, or any custom made series that inherits from AbstractLineSeries. A spline series is
exactly the same as a line series except that the lines are smoothed out to give them a flowing effect.
There are two types of built in splines. Catmullrom, as used here, goes through each point that is
plotted, or a B-Spline, which doesn't pass through each point and gives a smoother effect. Alternatively,
you can specify a custom 4x4 matrix of numbers to use for the spline. One interesting point about this
graph is that it shows how to override the default colors with colors of your own choosing.
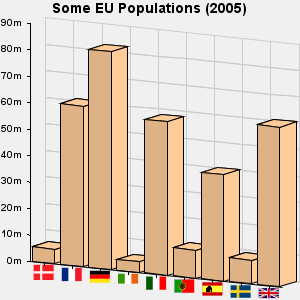
9.7 European Population - a Bar Graph demonstrating labels and HTML titles
<%@ taglib uri="http://big.faceless.org/products/graph" prefix="bfg" %>
<bfg:axesgraph width="300" height="300" backgroundcolor="#F0F0F0" backwallpaint="stripe(axis=bottom,line=#cccccc,altaxis=left)" xrotation="30" yrotation="30">
<bfg:label font="14pt bold Arial">Some EU Populations (2005)</bfg:label>
<bfg:axis pos="left" type="decimal(#m)"/>
<bfg:axis pos="bottom" type="marker" fontsize="20"/>
<bfg:barseries name="countries" color="#FFCC99" barwidth="80%">
<bfg:data x="flag.DK" y="5.432335" title="Denmark - 5.43m"/>
<bfg:data x="flag.FR" y="60.656178" title="France - 60.65m"/>
<bfg:data x="flag.DE" y="82.431390" title="Germany - 81.43m"/>
<bfg:data x="flag.IE" y="4.015676" title="Ireland - 4.02m"/>
<bfg:data x="flag.IT" y="58.103033" title="Italy - 58.1m"/>
<bfg:data x="flag.PT" y="10.566212" title="Portugal - 10.57m"/>
<bfg:data x="flag.ES" y="40.341462" title="Spain - 40.34m"/>
<bfg:data x="flag.SE" y="9.001774" title="Sweden - 9.0m"/>
<bfg:data x="flag.UK" y="60.441457" title="UK - 60.44m"/>
</bfg:barseries>
</bfg:axesgraph>
This example shows the use of a marker axis, which is a special type of Axis for use with
Bar graphs - the only difference being that the text for each bar is used as the name of a
marker, rather than displayed itself. The fontsize attribute is mandatory, and
controls the width of the marker (the height is scaled accordingly).
Another interested feature here is the title attribute being applied to each bar.
This attribute is an HTML4.0 attribute, rather than a Graph Library attribute, and so is
used by the Tag Library to create a simple tooltip for each bar. Try rolling the mouse over
one of the bars and leaving it there for a few seconds to see what we mean. More info on these
HTML 4.0 attributes is covered in the Interactive Graphs section
above.
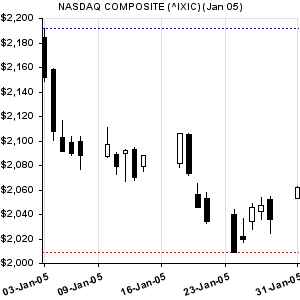
9.8 NASDAQ Composite - a Candle Graph demonstrating lines and rotated text on an axes
<%@ taglib uri="http://big.faceless.org/products/graph" prefix="bfg" %>
<bfg:axesgraph width="300" height="300" border="0" backwallpaint="stripe(axis=bottom,line=#E0E0E0)">
<bfg:label font="10pt bold Arial">NASDAQ COMPOSITE (^IXIC) (Jan 05)</bfg:label>
<bfg:axis pos="bottom" type="date(dd-MMM-yy)" rotate="-20" align="right" paddingright="-9" paddingtop="0" density="sparse"/>
<bfg:axis pos="left" type="decimal($#,###)"/>
<bfg:candleseries name="Stock" color="black" pos="bottom left" barwidth="50%">
<bfg:data x="2005-01-03" open="2184.75" max="2191.60" min="2148.72" close="2152.15"/>
<bfg:data x="2005-01-04" open="2158.31" max="2159.64" min="2100.56" close="2107.86"/>
<bfg:data x="2005-01-05" open="2102.90" max="2116.75" min="2091.24" close="2091.24"/>
<bfg:data x="2005-01-06" open="2098.51" max="2103.90" min="2088.03" close="2090.00"/>
<bfg:data x="2005-01-07" open="2099.95" max="2103.39" min="2076.69" close="2088.61"/>
<bfg:data x="2005-01-10" open="2087.62" max="2111.43" min="2086.66" close="2097.04"/>
<bfg:data x="2005-01-11" open="2089.07" max="2090.62" min="2072.62" close="2079.62"/>
<bfg:data x="2005-01-12" open="2089.70" max="2093.44" min="2066.79" close="2092.53"/>
<bfg:data x="2005-01-13" open="2093.54" max="2094.80" min="2067.94" close="2070.56"/>
<bfg:data x="2005-01-14" open="2079.47" max="2088.58" min="2075.47" close="2087.91"/>
<bfg:data x="2005-01-18" open="2081.86" max="2106.19" min="2078.04" close="2106.04"/>
<bfg:data x="2005-01-19" open="2105.74" max="2105.84" min="2072.20" close="2073.59"/>
<bfg:data x="2005-01-20" open="2056.38" max="2065.59" min="2045.88" close="2045.88"/>
<bfg:data x="2005-01-21" open="2053.15" max="2058.00" min="2032.88" close="2034.27"/>
<bfg:data x="2005-01-24" open="2040.13" max="2043.97" min="2008.68" close="2008.70"/>
<bfg:data x="2005-01-25" open="2022.08" max="2037.18" min="2017.58" close="2019.95"/>
<bfg:data x="2005-01-26" open="2034.69" max="2049.34" min="2028.19" close="2046.09"/>
<bfg:data x="2005-01-27" open="2042.77" max="2053.94" min="2036.09" close="2047.15"/>
<bfg:data x="2005-01-28" open="2052.54" max="2055.13" min="2024.36" close="2035.83"/>
<bfg:data x="2005-01-31" open="2053.47" max="2063.18" min="2053.47" close="2062.41"/>
<bfg:line y="2008.68" color="red" dash="2,2"/>
<bfg:line y="2191.60" color="blue" dash="2,2"/>
</bfg:candleseries>
</bfg:axesgraph>
Candle Graphs are generally used, as here, to show stock price movements. Two of the
features new in this graph are first the lines (drawn with the line) tag.
Lines can be drawn between any two points on the graph - here the X co-ordinates are not
specified, so they cover the full width of the graph.
Also new here is the formatting of the X axis. The values plotted here are rotated and have
had their alignment and padding changed to position them as they are.
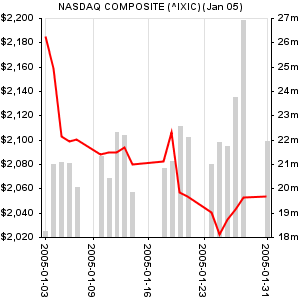
9.9 NASDAQ Composite again - combining bars and lines with two Y axes
<%@ taglib uri="http://big.faceless.org/products/graph" prefix="bfg" %>
<bfg:axesgraph width="300" height="300" border="0" backwallpaint="stripe(axis=bottom,line=#E0E0E0)">
<bfg:label font="10pt bold Arial">NASDAQ COMPOSITE (^IXIC) (Jan 05)</bfg:label>
<bfg:axis pos="bottom" type="date(yyyy-MM-dd)" rotate="90" paddingtop="5" paddingleft="-14" align="left top" density="sparse"/>
<bfg:axis pos="left" type="decimal($#,###)"/>
<bfg:axis pos="right" type="decimal(0m)"/>
<bfg:lineseries name="Price" color="red" pos="bottom left" linethickness="2">
<bfg:data x="2005-01-03" y="2184.75"/>
<bfg:data x="2005-01-04" y="2158.31"/>
<bfg:data x="2005-01-05" y="2102.90"/>
<bfg:data x="2005-01-06" y="2098.51"/>
<bfg:data x="2005-01-07" y="2099.95"/>
<bfg:data x="2005-01-10" y="2087.62"/>
<bfg:data x="2005-01-11" y="2089.07"/>
<bfg:data x="2005-01-12" y="2089.70"/>
<bfg:data x="2005-01-13" y="2093.54"/>
<bfg:data x="2005-01-14" y="2079.47"/>
<bfg:data x="2005-01-18" y="2081.86"/>
<bfg:data x="2005-01-19" y="2105.74"/>
<bfg:data x="2005-01-20" y="2056.38"/>
<bfg:data x="2005-01-21" y="2053.15"/>
<bfg:data x="2005-01-24" y="2040.13"/>
<bfg:data x="2005-01-25" y="2022.08"/>
<bfg:data x="2005-01-26" y="2034.69"/>
<bfg:data x="2005-01-27" y="2042.77"/>
<bfg:data x="2005-01-28" y="2052.54"/>
<bfg:data x="2005-01-31" y="2053.47"/>
</bfg:lineseries>
<bfg:barseries name="Volume" color="#D0D0D0" bordercolor="transparent" pos="bottom right" barwidth="50%">
<bfg:data x="2005-01-03" min="18" max="18.238000"/>
<bfg:data x="2005-01-04" min="18" max="20.981500"/>
<bfg:data x="2005-01-05" min="18" max="21.062200"/>
<bfg:data x="2005-01-06" min="18" max="21.050700"/>
<bfg:data x="2005-01-07" min="18" max="20.036300"/>
<bfg:data x="2005-01-10" min="18" max="21.346800"/>
<bfg:data x="2005-01-11" min="18" max="20.437700"/>
<bfg:data x="2005-01-12" min="18" max="22.313600"/>
<bfg:data x="2005-01-13" min="18" max="22.177000"/>
<bfg:data x="2005-01-14" min="18" max="19.838400"/>
<bfg:data x="2005-01-18" min="18" max="20.848600"/>
<bfg:data x="2005-01-19" min="18" max="21.116100"/>
<bfg:data x="2005-01-20" min="18" max="22.576700"/>
<bfg:data x="2005-01-21" min="18" max="22.102400"/>
<bfg:data x="2005-01-24" min="18" max="20.982700"/>
<bfg:data x="2005-01-25" min="18" max="21.919100"/>
<bfg:data x="2005-01-26" min="18" max="21.742200"/>
<bfg:data x="2005-01-27" min="18" max="23.753800"/>
<bfg:data x="2005-01-28" min="18" max="26.904600"/>
<bfg:data x="2005-01-31" min="18" max="21.931300"/>
</bfg:barseries>
</bfg:axesgraph>
Another view of the same data as above, but with volume information included. For the first time here we're plotting data against 2 different Y axes - price on the left and volume on the right (you can also have 2 X-axes if you wish at the top and bottom). Here the two axes are automatically sized against each other, although it's possible to control this with the verticalscaling and horizontalscaling attributes. We've also turned off borders on the bars by making them transparent, for a slightly different effect.
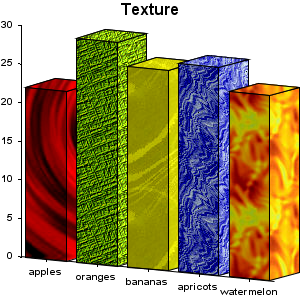
9.10 Painting with textures
<%@ taglib uri="http://big.faceless.org/products/graph" prefix="bfg" %>
<bfg:axesgraph width="300" height="300" xrotation="30" yrotation="20" lightlevel="100">
<bfg:label font="16pt bold Arial">Texture</bfg:label>
<bfg:barseries name="Fruit" barwidth="80%">
<bfg:data x="apples" y="22" color="file:/home/web/graph/examples/docresources/red156.jpg"/>
<bfg:data x="oranges" y="29" color="file:/home/web/graph/examples/docresources/green035.gif"/>
<bfg:data x="bananas" y="26" color="file:/home/web/graph/examples/docresources/yello040.jpg"/>
<bfg:data x="apricots" y="27" color="file:/home/web/graph/examples/docresources/blue003.jpg"/>
<bfg:data x="watermelon" y="24" color="file:/home/web/graph/examples/docresources/orang001.jpg"/>
</bfg:barseries>
</bfg:axesgraph>
Bitmap docresources can be used as paint. In the API this is done by simply creating a java.awt.TexturePaint object, whereas in the XML and JSP interface the image is specified as a URL (it may be a GIF, JPEG or PNG). Note the shading on the side away from the light.
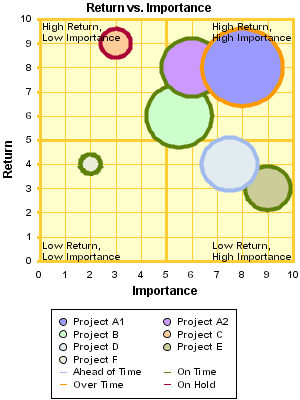
9.11 Bubbles
<%@ taglib uri="http://big.faceless.org/products/graph" prefix="bfg" %>
<bfg:axesgraph width="300" height="400" border="0" backwallpaint="stripe(#FFFFCC,axis=bottom,line=#FFCC33,altaxis=left)">
<bfg:label font="12pt bold Arial">Return vs. Importance</bfg:label>
<bfg:axis pos="left" type="int" min="0" max="10" linethickness="3" color="#FFCC33">
<bfg:label font="12pt bold Arial">Return</bfg:label>
</bfg:axis>
<bfg:axis pos="bottom" type="int" min="0" max="10" linethickness="3" color="#FFCC33">
<bfg:label font="12pt bold Arial">Importance</bfg:label>
</bfg:axis>
<bfg:bubbleseries name="Project A1" color="#9999FF">
<bfg:data x="8" y="8" xradius="1.6" yradius="1.6" xrange="0" yrange="0" color="#9999FF" bordercolor="#FF9900" linethickness="4"/>
</bfg:bubbleseries>
<bfg:bubbleseries name="Project A2" color="#CC99FF">
<bfg:data x="6" y="8" xradius="1.2" yradius="1.2" xrange="0" yrange="0" color="#CC99FF" bordercolor="#5E8109" linethickness="4"/>
</bfg:bubbleseries>
<bfg:bubbleseries name="Project B" color="#CCFFCC">
<bfg:data x="5.5" y="6" xradius="1.3" yradius="1.3" xrange="0" yrange="0" color="#CCFFCC" bordercolor="#5E8109" linethickness="4"/>
</bfg:bubbleseries>
<bfg:bubbleseries name="Project C" color="#FFCC99">
<bfg:data x="3" y="9" xradius="0.6" yradius="0.6" xrange="0" yrange="0" color="#FFCC99" bordercolor="#AA0036" linethickness="4"/>
</bfg:bubbleseries>
<bfg:bubbleseries name="Project D" color="#E2EBF0">
<bfg:data x="7.5" y="4" xradius="1.1" yradius="1.1" xrange="0" yrange="0" color="#E2EBF0" bordercolor="#A1BBEE" linethickness="4"/>
</bfg:bubbleseries>
<bfg:bubbleseries name="Project E" color="#CCCC99">
<bfg:data x="9" y="3" xradius="0.9" yradius="0.9" xrange="0" yrange="0" color="#CCCC99" bordercolor="#5E8109" linethickness="4"/>
</bfg:bubbleseries>
<bfg:bubbleseries name="Project F" color="#E9ECD9">
<bfg:data x="2" y="4" xradius="0.4" yradius="0.4" xrange="0" yrange="0" color="#E9ECD9" bordercolor="#5E8109" linethickness="4"/>
<bfg:line x="10" linethickness="3" color="#FFCC33"/>
<bfg:line x="5" linethickness="3" color="#FFCC33"/>
<bfg:line y="10" linethickness="3" color="#FFCC33"/>
<bfg:line y="5" linethickness="3" color="#FFCC33"/>
<bfg:label x="0.10" y="0.45" align="left" textcolor="#000000">Low Return,
Low Importance</bfg:label>
<bfg:label x="9.97" y="0.45" align="right" textcolor="#000000">Low Return,
High Importance</bfg:label>
<bfg:label x="0.10" y="9.95" align="left top" textcolor="#000000">High Return,
Low Importance</bfg:label>
<bfg:label x="9.97" y="9.95" align="right top" textcolor="#000000">High Return,
High Importance</bfg:label>
</bfg:bubbleseries>
<bfg:key align="bottom" bordercolor="black">
<bfg:keyitem series="Project A1"/>
<bfg:keyitem series="Project A2"/>
<bfg:keyitem series="Project B"/>
<bfg:keyitem series="Project C"/>
<bfg:keyitem series="Project D"/>
<bfg:keyitem series="Project E"/>
<bfg:keyitem series="Project F"/>
<bfg:keyitem marker="line" color="white" bordercolor="white"/>
<bfg:keyitem marker="line" color="#A1BBEE" bordercolor="#A1BBEE">Ahead of Time</bfg:keyitem>
<bfg:keyitem marker="line" color="#5E8109" bordercolor="#5E8109">On Time</bfg:keyitem>
<bfg:keyitem marker="line" color="#FF9900" bordercolor="#FF9900">Over Time</bfg:keyitem>
<bfg:keyitem marker="line" color="#AA0036" bordercolor="#AA0036">On Hold</bfg:keyitem>
</bfg:key>
</bfg:axesgraph>
Bubble graphs can be used for all sorts of things, as you can see here. Once again we're creating a custom key, and using the border color of the bubble to convey information as well.
9.12 JavaScript Rollovers
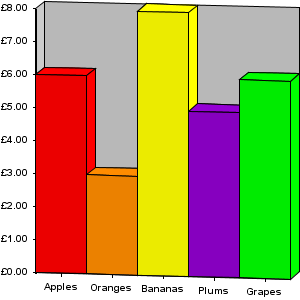
<%@ taglib uri="http://big.faceless.org/products/graph" prefix="bfg" %>
<bfg:axesgraph width="300" height="300" xrotation="10" yrotation="10" border="0" backwallpaint="#CCCCCC">
<bfg:axis pos="left" type="currency" wallpaint="#CCCCCC"/>
<bfg:barseries name="YourSeries">
<bfg:data x="Apples" y="6" color="red" onmousemove="bfgShowPopup('Apples = 6', event)" onmouseout="bfgHidePopup()" href="javascript:alert('Clicked Apples')"/>
<bfg:data x="Oranges" y="3" color="#FF8C00" onmousemove="bfgShowPopup('Oranges = 3', event)" onmouseout="bfgHidePopup()"/>
<bfg:data x="Bananas" y="8" color="yellow" onmousemove="bfgShowPopup('Bananas = 8', event)" onmouseout="bfgHidePopup()" onclick="alert('Boo!')"/>
<bfg:data x="Plums" y="5" color="#9400D3" onmousemove="bfgShowPopup('Plums = 5', event)" onmouseout="bfgHidePopup()"/>
<bfg:data x="Grapes" y="6" color="green" onmousemove="bfgShowPopup('Grapes = 6', event)" onmouseout="bfgHidePopup()"/>
</bfg:barseries>
</bfg:axesgraph>
This graph shows how to use JavaScript in a graph. Similar to the Population graph above,
HTML 4.0 attributes are embedded into the Tags, which are then processed by the Tag library
to create JavaScript actions for certain areas. Here we're using some simple JavaScript
functions which are supplied with the Graph Library to create Popups, although any
JavaScript can be called. See the Interactive Graphs section above
for more information.
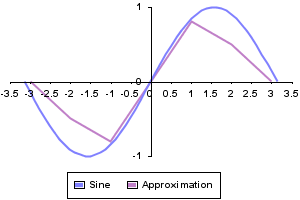
9.13 Mathematical Curves - plotting functions and rollovers on lines
<%@ taglib uri="http://big.faceless.org/products/graph" prefix="bfg" %>
<bfg:axesgraph width="300" height="200">
<bfg:axis pos="left" type="float" zerointersection="true" density="minimal"/>
<bfg:axis pos="bottom" type="float" zerointersection="true"/>
<bfg:functionseries name="Sine" min="-3.1416" max="3.1416" method="java.lang.Math.sin" linethickness="2"/>
<bfg:lineseries name="Approximation" linethickness="2" onmousemove="bfgShowPopup(bfgRound(seriesx,2) +'='+bfgRound(seriesy,2), event)" onmouseout="bfgHidePopup()">
<bfg:data x="-3" y="0"/>
<bfg:data x="-2" y="-0.5"/>
<bfg:data x="-1" y="-0.8"/>
<bfg:data x="1" y="0.8"/>
<bfg:data x="2" y="0.5"/>
<bfg:data x="3" y="0"/>
</bfg:lineseries>
<bfg:key align="bottom" bordercolor="black"/>
</bfg:axesgraph>
A very simple example showing the functionseries class, which can be used to
plot a linegraph representing a continuous function (rather than sampled data). The actual
function can be any static method which takes a single double and returns a single double -
here we use Math.sin. We've added a rollover to this graph as well.
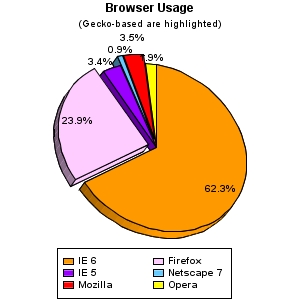
9.14 Pie Graphs
<%@ taglib uri="http://big.faceless.org/products/graph" prefix="bfg" %>
<bfg:piegraph height="300" width="300" yrotation="-30" xrotation="-20" defaultcolors="#FF9900, #FFCCFF, #9900FF, #66CCFF, red, yellow, green">
<bfg:label font="12pt bold Arial" paddingbottom="10">Browser Usage</bfg:label>
<bfg:label font="10pt Arial" paddingbottom="10">(Gecko-based are highlighted)</bfg:label>
<bfg:data key="IE 6" value="62.3%">
<bfg:label>62.3%</bfg:label>
</bfg:data>
<bfg:data key="Firefox" value="23.9%" extend="10%">
<bfg:label>23.9%</bfg:label>
</bfg:data>
<bfg:data key="IE 5" value="3.4%">
<bfg:label distance="1">3.4%</bfg:label>
</bfg:data>
<bfg:data key="Netscape 7" value="0.9%" extend="10%">
<bfg:label distance="1">0.9%</bfg:label>
</bfg:data>
<bfg:data key="Mozilla" value="3.5%" extend="10%">
<bfg:label distance="1.05">3.5%</bfg:label>
</bfg:data>
<bfg:data key="Opera" value="1.9%">
<bfg:label distance="1">1.9%</bfg:label>
</bfg:data>
<bfg:key align="bottom" bordercolor="black"/>
</bfg:piegraph>
Piegraphs are the only type of graph currently supported which aren't plotted against axes.
They're the simplest type of graph and, like all the others, are fully 3D so can be rotated
as required. Slices can be extended (as here) with the extend attribute.
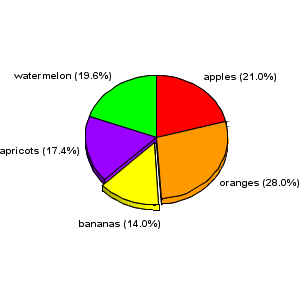
9.15 More Pie Graphs
<%@ taglib uri="http://big.faceless.org/products/graph" prefix="bfg" %>
<bfg:piegraph height="300" width="300" yrotation="-30" defaultcolors="red, #FF9900, yellow, #9900FF, green">
<bfg:data key="apples" value="30">
<bfg:label distance="1.1">apples (21.0%)</bfg:label>
</bfg:data>
<bfg:data key="oranges" value="40">
<bfg:label distance="1.1">oranges (28.0%)</bfg:label>
</bfg:data>
<bfg:data key="bananas" value="20" extend="10%">
<bfg:label distance="1.3">bananas (14.0%)</bfg:label>
</bfg:data>
<bfg:data key="apricots" value="25">
<bfg:label distance="1.1">apricots (17.4%)</bfg:label>
</bfg:data>
<bfg:data key="watermelon" value="28">
<bfg:label distance="1.1">watermelon (19.6%)</bfg:label>
</bfg:data>
</bfg:piegraph>
Another type of pie.
9.16 A scatter graph
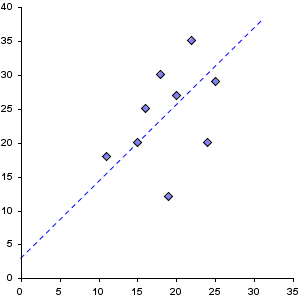
<%@ taglib uri="http://big.faceless.org/products/graph" prefix="bfg" %>
<bfg:axesgraph width="300" height="300">
<bfg:axis pos="left" type="int" min="0" max="40"/>
<bfg:axis pos="bottom" type="int" min="0" max="35"/>
<bfg:scatterseries name="Sample Points" type="diamond">
<bfg:data x="19" y="12"/>
<bfg:data x="22" y="35"/>
<bfg:data x="15" y="20"/>
<bfg:data x="16" y="25"/>
<bfg:data x="25" y="29"/>
<bfg:data x="24" y="20"/>
<bfg:data x="18" y="30"/>
<bfg:data x="11" y="18"/>
<bfg:data x="20" y="27"/>
<bfg:line x1="0" y1="3" x2="31" y2="38" linethickness="1" dash="5,4" color="blue" name="best fit"/>
</bfg:scatterseries>
</bfg:axesgraph>
A scatter graph can be drawn by either creating a graph and adding a whole lot of marker
elements to it, or, if you prefer, by using a scatterseries. The effect is identical.
9.17 Logarithmic Axes
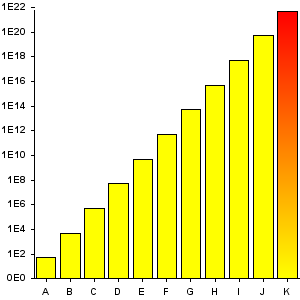
<%@ taglib uri="http://big.faceless.org/products/graph" prefix="bfg" %>
<bfg:axesgraph width="300" height="300">
<bfg:axis pos="left" type="log(decimal(0.#E0))"/>
<bfg:axis pos="bottom" type="bar"/>
<bfg:barseries name="extremes" barwidth="80%" color="yellow">
<bfg:data x="A" y="50"/>
<bfg:data x="B" y="5000"/>
<bfg:data x="C" y="500000"/>
<bfg:data x="D" y="50000000"/>
<bfg:data x="E" y="5000000000"/>
<bfg:data x="F" y="500000000000"/>
<bfg:data x="G" y="50000000000000"/>
<bfg:data x="H" y="5000000000000000"/>
<bfg:data x="I" y="500000000000000000"/>
<bfg:data x="J" y="50000000000000000000"/>
<bfg:data x="K" y="5000000000000000000000" color="gradient(yellow,red)"/>
</bfg:barseries>
</bfg:axesgraph>
Like the Gap in the TV Ratings example, any axis can be turned into a logarithmic axis by
wrapping log(...) around it. This is ideal for displaying values over a very
large range, as we're doing here.
9.18 A Dial Graph
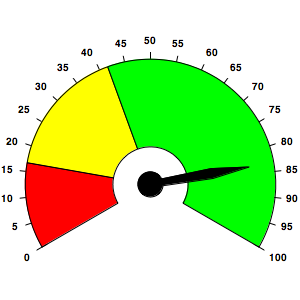
<%@ taglib uri="http://big.faceless.org/products/graph" prefix="bfg" %>
<bfg:dialgraph height="300" width="300">
<bfg:segment startangle="-120" endangle="-80" inner="30" outer="100" color="red"/>
<bfg:segment startangle="-80" endangle="-20" inner="30" outer="100" color="yellow"/>
<bfg:segment startangle="-20" endangle="120" inner="30" outer="100" color="green"/>
<bfg:segment startangle="0" endangle="360" inner="0" outer="10" color="black"/>
<bfg:needle angle="80" waist="50" waistwidth="8" end="80" color="black"/>
<bfg:tick startangle="-120" endangle="120" step="12" inner="100" outer="105" color="black"/>
<bfg:labels startangle="-120" endangle="120" step="12" distance="110" startvalue="0" endvalue="100"/>
</bfg:dialgraph>
Dial graphs consist mainly of segments and needles, and are very simple to create. You can
have as many of each as you need. Labels can be added around the outside of the graph or
at any point on the dial.
9.19 Some newer features
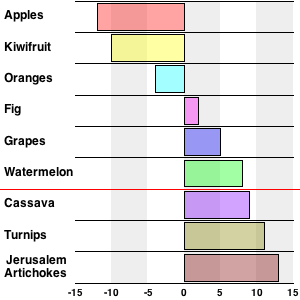
<%@ taglib uri="http://big.faceless.org/products/graph" prefix="bfg" %>
<bfg:axesgraph bordercolor="none" height="300" width="300" zrotation="90">
<bfg:stripe altaxis="bottom" axis="right" fill="#fff,#eee" linethickness="0.5" line="black" lineaxes="main"/>
<bfg:axis pos="bottom" type="bar" fontsize="12" align="box right middle" color="none" />
<bfg:axis pos="right" type="integer" density="sparse" align="top center" color="none" />
<bfg:barseries name="mybars" bordercolor="none" barwidth="86%" pos="bottom right">
<bfg:data x="Apples" y="-12.0" color="rgba(255,0,0,0.2)"/>
<bfg:data x="Kiwifruit" y="-10.0" color="rgba(255,255,0,0.2)"/>
<bfg:data x="Oranges" y="-4.0" color="rgba(0,255,255,0.2)"/>
<bfg:data x="Fig" y="2.0" color="rgba(255,0,255,0.2)"/>
<bfg:data x="Grapes" y="5.0" color="rgba(0,0,255,0.2)"/>
<bfg:data x="Watermelon" y="8.0" color="rgba(0,255,0,0.2)"/>
<bfg:data x="Cassava" y="9.0" color="rgba(128,0,255,0.2)"/>
<bfg:data x="Turnips" y="11.0" color="rgba(128,128,0,0.2)"/>
<bfg:data x="Jerusalem Artichokes" y="13.0" color="rgba(128,0,0,0.2)"/>
<bfg:line x="5.5" y1="-999" y2="999" color="red" overflow="true"/>
<bfg:/barseries>
<bfg:/axesgraph>
Here's a demonstration of some of the newer features added in 2.4.7.
- We're using the <stripe> element instead of setting the "backwallpaint" on the axesgraph to a stripe - the functionality is the same, but it's a bit cleaner. We're setting "lineaxes" to "main", to ensure our black lines are only drawn against the main (or primary) axis. Other acceptable values are "alternate" and "both" (the default), which draws the lines in a grid against both axes
- The alignment for the "bottom" axis (on the left, due to the axesgraph zrotation) has the token "box" added to it. This will cause the items on the axis to be aligned as one unit, rather than individually. It's as if all the key items were added to a box, then that box was aligned according to the "align" attribute. IN this case it's right-aligned against the axis
- The red line is drawn on the graph by first setting its "x" value to 5.5 - why this value? Items on a bar axis are converted to numbers internally, so the first item "Apples" is 0, the next item "Kiwifruit" is 1 and so on. The value 5.5 will draw a line between the 5th and 6th items. The "y1" and "y2" values are set to numbers well outside the bounds of the graph, but the "overflow" attribute prevents these coordinates from having an impact on the sizing algorith, for the graph - they can overflow the edge of the image.
Also note the final data item has a line break in the middle of the word, to split the text onto two lines. You can do this by adding a newline to the data, which (in an XML attribute) means adding